Content
Try for freeAnalytics
October 15, 2025
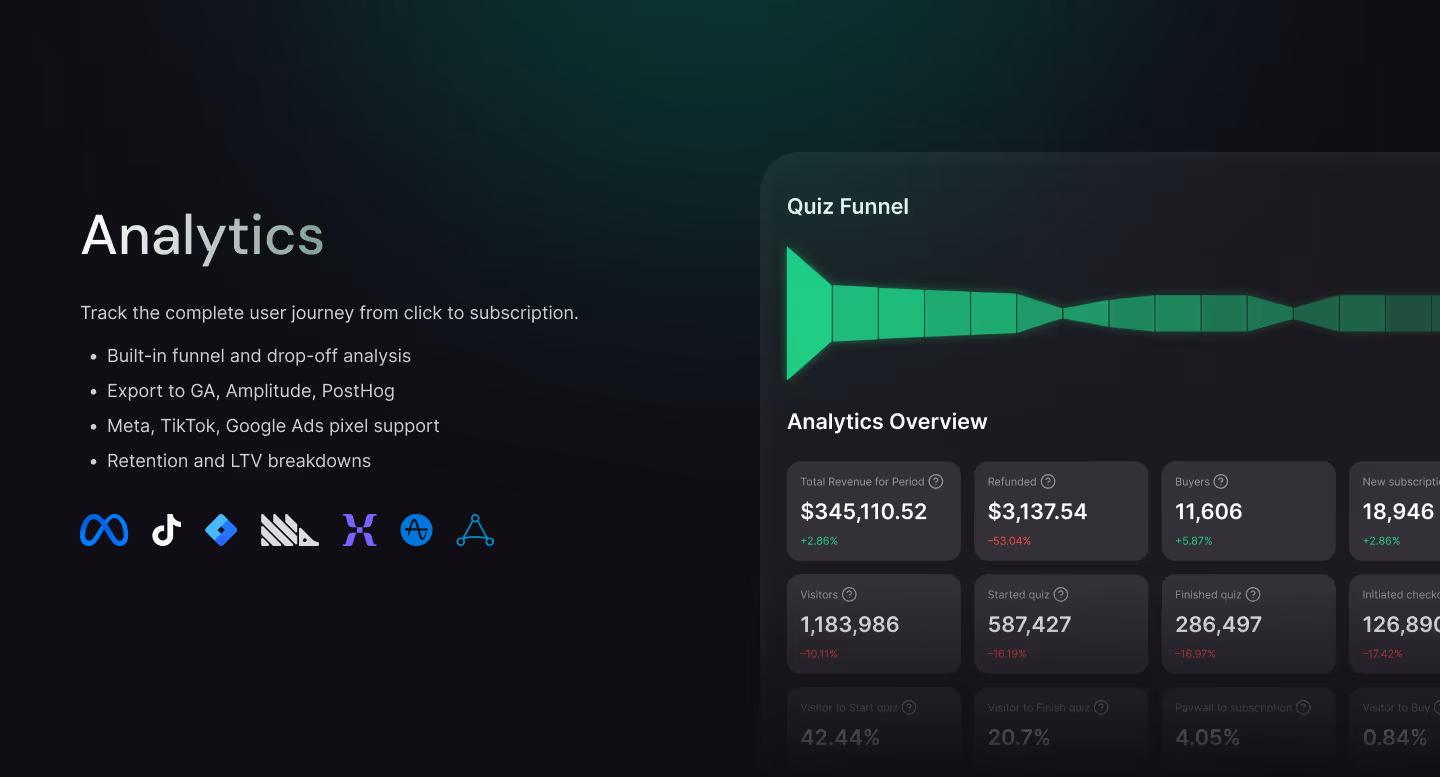

Analytics
Track the complete user journey from click to subscription
See exactly how users move through your funnel with automatic event tracking at every step. Monitor revenue, identify drop-off points, and understand which traffic sources drive the most valuable subscribers.
Visual funnel analysis
Watch your users flow through the entire conversion path:
- Quiz funnel visualization showing progression through each question
- Drop-off rates at every screen
- Conversion metrics from quiz start to paywall
- Payment completion rates
- Real-time visitor counts and active sessions
Revenue dashboard
Monitor your financial performance at a glance:
- Total revenue - See earnings for any time period with trend indicators
- Refunds tracking - Monitor refund amounts and rates
- New subscribers - Track daily, weekly, and monthly subscription growth
- Buyers count - Know how many unique users converted
- Revenue per source - Identify which campaigns drive the most value
User journey tracking
Follow every action from first click to subscription:
- Visitors - Total traffic to your funnels
- Quiz starts - How many users begin the quiz
- Quiz completions - Completion rate and drop-off analysis
- Paywall views - Users who reach the payment screen
- Conversion rates - Percentage at each funnel stage
UTM attribution
Connect every subscription back to its original source:
- Track performance by campaign, ad set, and creative
- See which UTM parameters drive the best results
- Filter revenue by traffic source, country, or device
- Measure ROI for every marketing dollar spent
- No mobile measurement partner needed (but compatible if you use one)
Ad platform integration
Send conversion events directly to your ad platforms:
- Meta Pixel - Track events and optimize Facebook/Instagram campaigns
- TikTok Pixel - Measure TikTok ad performance
- Google Ads - Report conversions for search and display campaigns
- Snapchat Pixel - Optimize Snapchat advertising campaigns
- Pinterest Tag - Track Pinterest ad conversions
- AppLovin - Measure mobile ad network performance
- Works post-ATT since web cookies are allowed
- Automatic event firing with proper attribution
Export to your tools
Send data wherever you need it:
- Google Analytics 4
- Amplitude
- PostHog
- Custom webhooks for any platform
- Raw event export for your own analysis
Quiz performance comparison
Understand which versions convert better:
- Compare conversion rates across quiz versions
- See revenue generated by each variant
- Track changes over time with version history
- Identify which questions or screens impact conversion
- Monitor performance before and after changes
Retention & LTV metrics
Track long-term subscriber value:
- Subscription renewal rates
- Churn analysis by cohort
- Lifetime value by traffic source
- Revenue per subscriber over time
- Identify highest-value acquisition channels
User-level insights
Drill down into individual user behavior:
- View complete event history for any user
- See quiz answers, paywall interactions, and payment details
- Filter users by country, UTM source, or campaign
- Debug funnel issues by examining specific user paths
- Understand why certain users convert and others don't
Why analytics matter: You can't improve what you don't measure. Track every touchpoint to identify bottlenecks, optimize your funnel, and maximize revenue from every visitor.
See how it works
Watch Demo Video - A complete walkthrough of the platform and how everything works together.
Related features
Quiz Builder - Create engaging quizzes with built-in analytics that track user answers and progression through each question.
Paywall Builder - Monitor paywall performance with detailed conversion metrics, pricing tier selection, and payment method preferences.
Share this Article
Build your web funnel with web2wave
Start using web funnels: Launch faster, convert better, and keep more revenue with no app store limitations